How to Design a Medallion Architecture for Real-Time Intelligence
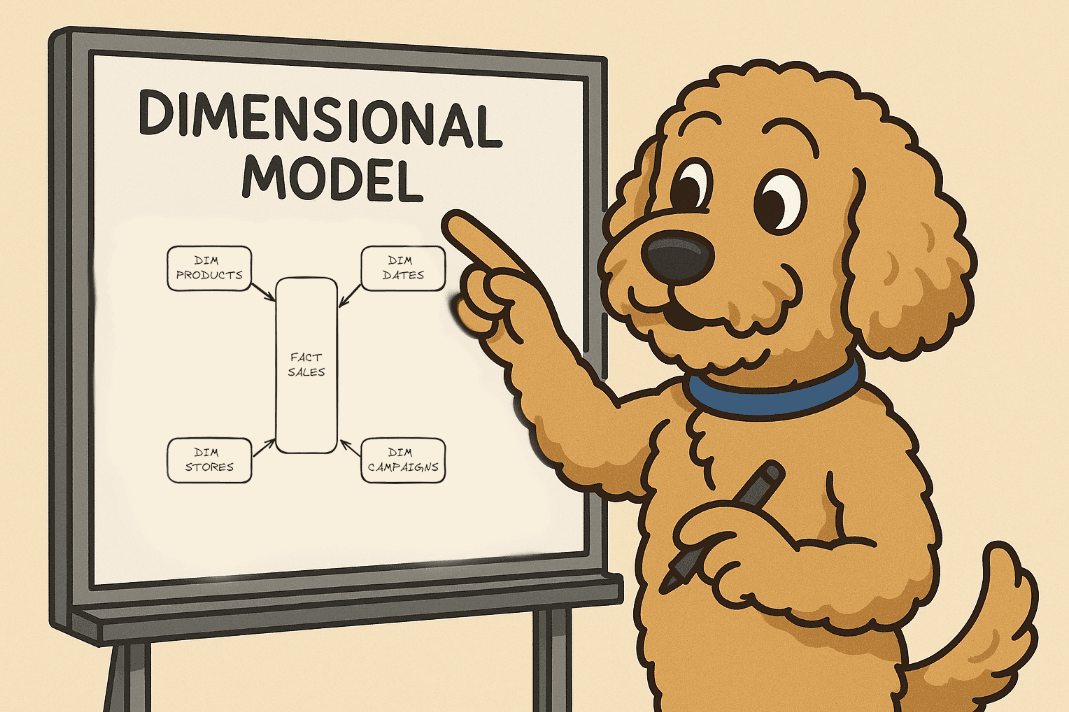
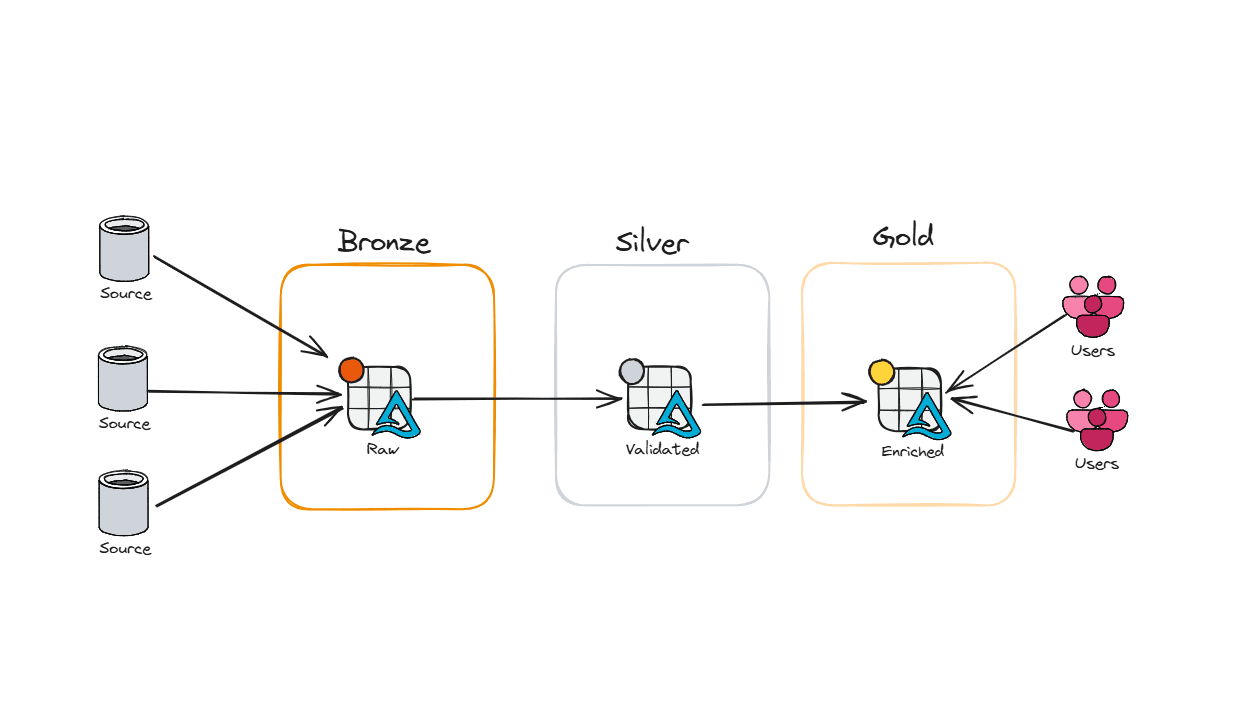
In my last post on medallion architecture, we talked about Bronze, Silver, and Gold layers — how to land your data, clean it, and serve it up in a way that doesn't make your analysts cry. That post was focused on batch: scheduled pipelines, predictable loads, data that waits politely for its turn.
But what happens when your data doesn't wait?
What happens when a customer abandons a cart, a machine on the factory floor throws an error, or a fraudulent transaction hits your payment system — and you need to know about it in seconds, not hours?
That's where streaming comes in. And no, streaming medallion isn't just "batch but faster." It's a fundamentally different way of thinking about your pipeline — one where the tools change, the tradeoffs change, and the failure modes change. The good news is the layers themselves — Bronze, Silver, Gold — still hold up. You're just building them with different materials.
Batch vs. Streaming: The Core Difference
Before we get into the architecture, let's be honest about what we're actually changing.
In batch, you tolerate staleness. You run a pipeline every hour, every night, or every week — and that's fine, because the business question doesn't demand anything fresher. "What were yesterday's sales by region?" works just fine on a midnight load.
In streaming, staleness is the problem. Fraud detection that runs every hour isn't fraud detection — it's an audit. A real-time inventory dashboard that's 45 minutes behind might as well be wrong. When the business question has a latency requirement, batch doesn't cut it.
The other thing that changes is tolerance for imperfection. In batch, your data arrives in a tidy package: here's everything that happened between 2 AM and 3 AM, in order, go process it. In streaming, data arrives out of order, at irregular intervals, sometimes duplicated, and occasionally very late. A mobile app might buffer events when the device is offline and flush them 20 minutes later. An IoT sensor might retry a failed send. Your pipeline needs to handle all of that gracefully — or you end up with numbers that quietly don't add up.
The Fabric Real-Time Intelligence Stack
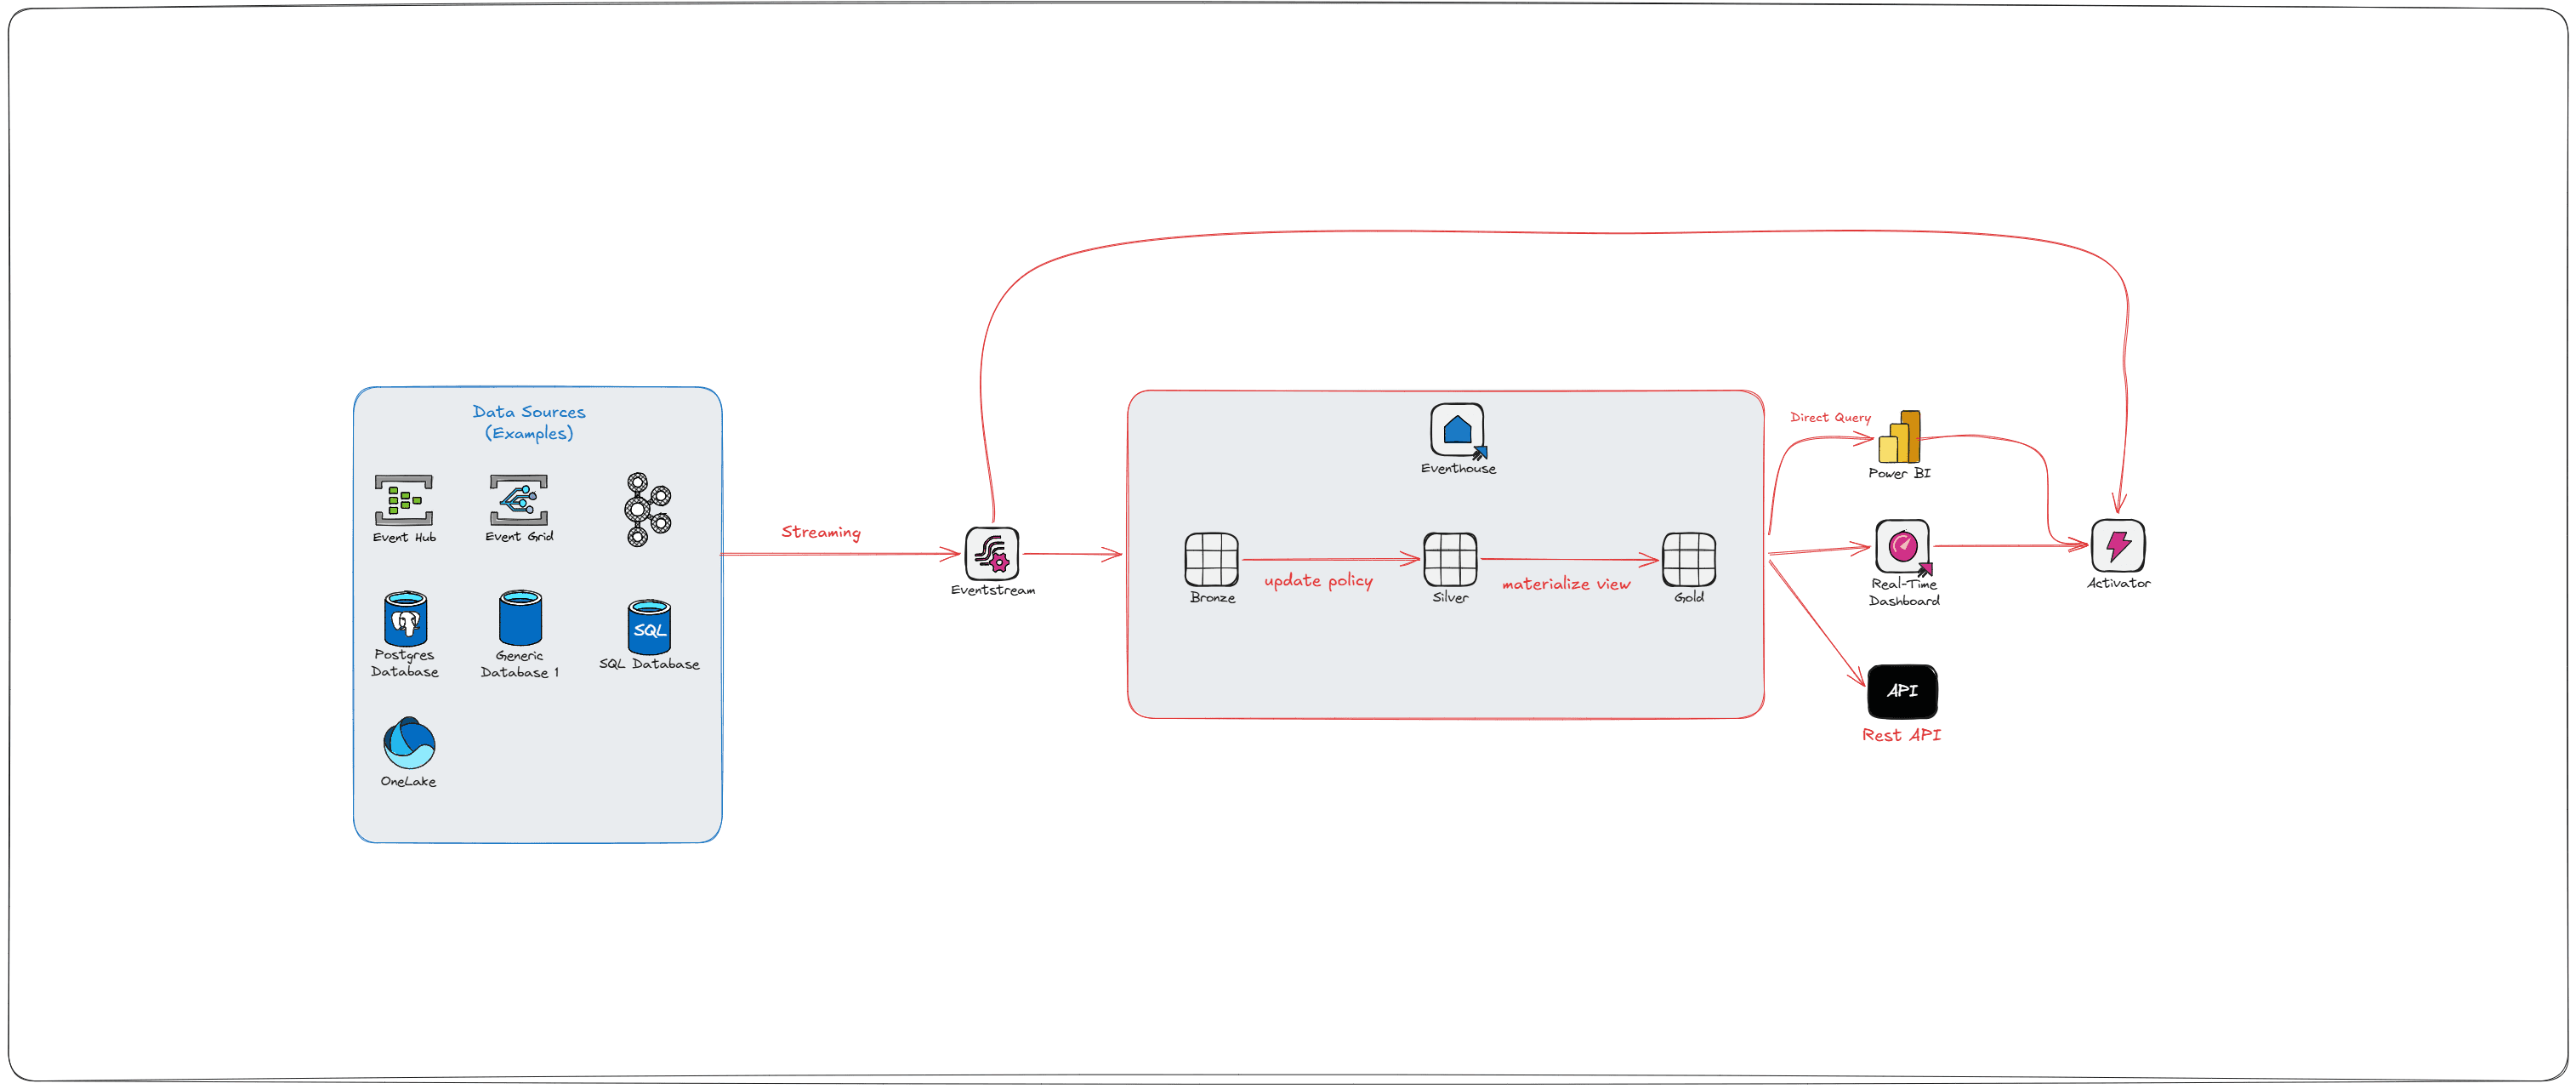
Microsoft Fabric has a purpose-built stack for streaming workloads under its Real-Time Intelligence (RTI) umbrella. The goal, in Microsoft's own framing, is to go from "data-in-motion to action-in-motion." Here's what that actually looks like in practice:
Event Hubs / Kafka — the source. This is where your event producers (apps, devices, services) push data. Event Hubs is Azure's managed service; Kafka is the open-source equivalent that Fabric also supports natively.
Eventstream — Fabric's no-code/low-code ingestion layer. It connects to your Event Hubs or Kafka topic, fans data out to multiple destinations simultaneously (Eventhouse, Lakehouse, Activator), and can apply lightweight transformations and schema validation before data arrives downstream.
Eventhouse / KQL Database — the real-time analytics engine. Built for high-frequency, time-series, append-heavy workloads. Uses KQL (Kusto Query Language). This is where Bronze, Silver, and Gold live for streaming workloads — not as physically separated storage locations, but as logical layers implemented through ingestion policies and query constructs.
Activator — the action engine. This is the part most batch-centric data engineers haven't heard of, and it's worth paying attention to. Activator watches your data for conditions and thresholds, then fires automated actions: Teams messages, Power Automate flows, email alerts, pipeline triggers, notebook runs. It's what turns a streaming architecture from a "reporting faster" play into a genuine "respond to events" platform.
Bronze: Capture Everything, Immediately
The Bronze mindset in streaming is the same as in batch: land it raw, land it fast, don't drop anything.
In batch, Bronze usually means a Lakehouse table — append-only, full fidelity, whatever format the source sent. In streaming, the same principle applies, but the Eventhouse is a better home for raw high-frequency events. KQL Databases are built for this exact scenario — they can ingest millions of events per second, handle out-of-order arrival natively, and don't suffer from the small-file problem that plagues Delta tables under heavy write loads. (If you've read my post on Silver layer optimization, you know exactly what I mean.)
Your Bronze KQL table should be append-only, preserve the full original payload, and include both an event timestamp (when the thing happened) and an ingestion timestamp (when it arrived). These are not the same thing. In a perfect world, they're milliseconds apart. In the real world, mobile apps go offline, networks hiccup, sensors retry — and debugging a downstream discrepancy almost always requires going back to both.
One thing worth flagging early: how Eventstream gets data into Eventhouse matters. There are two modes:
Pull mode is faster and cheaper. The Eventhouse itself reaches out to the underlying Event Hub and pulls events. No extra transformation layer. This is the default for direct Bronze landing.
Push mode kicks in when you apply transformations inside Eventstream. Under the covers, Fabric spins up an Azure Stream Analytics job to process your data before pushing it to the destination. This is powerful, but it adds cost and latency — so apply transformations in Eventstream only when you genuinely need them at that layer.
The other thing Bronze gets right by design is schema drift — or rather, the absence of it. Store your raw payload as a dynamic column in KQL, which is Kusto's semi-structured type for JSON. No columns to enforce, no fields to map, no pipeline to break when the source team renames something without telling anyone. You're just landing the event exactly as it arrived. Schema drift becomes Silver's problem — which is exactly where it should be, since that's where you're actually parsing dynamic fields into typed columns. If a malformed payload is going to cause issues, let it surface there through your update policy, where you can handle it with a dead-letter routing pattern, rather than at Bronze where you're trying to touch as little as possible.
Silver: Transform on the Way In
This is where streaming medallion gets interesting — and where most people either get it right or create a mess they'll regret later.
In the Eventhouse, Silver transformations are handled primarily through KQL Update Policies. An update policy is a rule attached to a target table that says: "whenever data lands in Bronze, run this KQL function and write the result here." It fires automatically at ingest time — which means your Silver table stays in sync with Bronze without any separate pipeline job.
A few things to understand about how update policies actually work under the hood, because they have real operational implications:
They execute synchronously at ingestion time. That means a poorly designed update policy doesn't just slow down your Silver table — it slows down Bronze ingestion itself. Keep them lean and deterministic.
If an update policy query fails, Bronze ingestion still succeeds. Your source table gets the data, but the target table doesn't. Use
.show ingestion failuresto catch these — they won't announce themselves otherwise.You cannot chain update policies. If your Silver table has its own update policy, Fabric will not recursively fire it. Bronze → Silver is fine. Bronze → Silver → Gold via update policies is not supported.
Update policies are ideal for: parsing raw JSON or string payloads into typed columns, renaming or reshaping fields to match your enterprise schema, enriching events with reference data (device IDs → device types, store codes → store names), and forking a raw stream into multiple shaped tables for different consumer teams.
What update policies are not ideal for: anything stateful. And "stateful" is worth unpacking, because it's where a lot of people get tripped up.
Update policies are stateless — they only know about the events in the current ingestion batch. They have no memory of what came before. If your logic can be answered by looking at a single row in isolation, update policies work great. If your logic requires "look at this row and remember what happened before," you need something with memory.
Examples:
Cart abandonment detection. A customer adds items to their cart and goes quiet. You want to fire an alert after 15 minutes of inactivity. An update policy can't do this — when the next event arrives, it can see that event, but it has no way of knowing when that customer last did anything, or whether 15 minutes have elapsed since their last cart action. That requires tracking state across events, specifically last-activity-time per customer.
Card velocity fraud detection — "flag if the same payment card is used three or more times in five minutes." The update policy sees one transaction. It can't count how many times that card has appeared in the last five minutes because those events already landed before this ingestion batch.
For these patterns, Activator is the right tool. It maintains in-memory state per tracked entity (per customer, per card, per device) and evaluates rules across that history — exactly what update policies can't do. For more complex stateful aggregations, a scheduled KQL query against your Bronze or Silver table can cover the gap.
The other thing Silver has to deal with is late-arriving data. Your pipeline needs to decide: how long do I wait for out-of-order events before closing a time window? There's no universal answer, but not having one is worse than having a slightly wrong one. Pick a watermark, document it, and make sure your downstream materialized views account for it.
Gold: Real-Time Insights, Not Real-Time Regrets
Gold in streaming is where you ask: what does the business actually need to see, and how fresh does it need to be?
In the Eventhouse, Gold is typically served through Materialized Views. A materialized view pre-computes an aggregation over a source table and maintains it incrementally as new data arrives. The internal architecture is worth understanding: the engine maintains a hidden physical table (the materialized part) plus a "delta" of recently ingested records that haven't been materialized yet. When you query a materialized view, you get both parts combined — so you're never looking at stale data, even between materialization cycles.
A few constraints worth knowing: materialized views are defined over a single source table with a single summarize statement. No joins. No multi-stage logic. No chaining (except in the narrow case where the upstream view uses take_any() for deduplication). If you need those things, materialize into an intermediate table first and then build the view on top of it.
For performance-critical dashboards where you'd rather trade a few minutes of freshness for guaranteed sub-second query times, you can reference only the materialized portion using materialized_view("ViewName", max_age). If the view was materialized more recently than max_age, you get the fast pre-computed result. If it's stale, the engine falls back to querying the full table. Useful lever to have when your ops team is staring at a live dashboard during an incident.
Common Gold materialized view patterns:
Downsampling:
summarize count() by bin(Timestamp, 1h)— great for time-series dashboards and trend linesLast known state:
summarize arg_max(Timestamp, *) by DeviceId— current status per entityDeduplication:
summarize take_any(*) by EventId, SessionId— clean up noisy or retried event streams
For your Power BI real-time dashboards, the modeling guidance from a streaming context mirrors what you'd do in batch: fact tables on DirectQuery, small dimension tables on Dual mode. The key difference is that your fact table is now a KQL materialized view or table queried directly — which means datetime handling matters a lot. Always work in UTC inside Eventhouse. Convert to local time at the visualization layer, not in the query, or you'll pay for it in performance.
The reason is subtle but important: Eventhouse indexes on UTC datetime. If you run datetime_utc_to_local() inside your KQL query, the conversion happens before the filter gets applied, which means the engine can't use the index to push your time range filter down. You've just turned a fast indexed scan into a full table scan. Filter first in UTC, then convert for display.
The cleanest place to do the conversion is a DAX measure in your Power BI semantic model. That way the KQL query runs against UTC (fast), and only the values that survive the filter get converted for display. A simple example for Eastern Time:
Transaction Time (Eastern) =
[TransactionTimestamp] - TIME(5, 0, 0)
A couple of caveats: this approach uses a fixed offset, which means you'll need to update it for daylight saving time (or build DST logic into the measure). For most operational dashboards where users are looking at the last few hours of data, a static offset is fine. For anything that spans DST transitions, you'll want a more robust time zone table or a calculated column on your date dimension that accounts for DST by date range. Either way, keep the conversion in DAX — not in KQL.
Beyond Gold: Activator and the Action Layer
Here's where streaming architecture does something batch simply can't: it closes the loop.
In a batch world, Gold is the end of the line. You produce reports, people look at them, and — if something's wrong — someone notices, opens a ticket, and eventually someone acts. In streaming, you can skip the human in the middle.
Activator connects to your Eventhouse data and watches for conditions: a temperature sensor crossing a threshold, a fulfillment SLA at risk, a fraud pattern matching a known signature. When the condition fires, Activator executes: a Teams alert to the operations team, a Power Automate flow to open a work order, a Fabric pipeline to trigger a remediation process.
Activator supports both stateless rules (value > threshold, evaluated on every event) and stateful rules that track transitions ("value exceeded threshold for more than 5 consecutive minutes" or "device went offline"). It maintains in-memory state per tracked entity — per device, per order, per session — and includes suppression logic so you're not bombarding your team with 10,000 alerts for the same event.
The reason this matters architecturally is that it changes the design conversation. You're not just asking "how do we store and query this data faster?" You're asking "what should happen when this data means something?" That's a more interesting question — and one that's worth having with your business stakeholders before you finalize your Gold layer design.
OneLake Availability: One Copy, Two Worlds
Here's where things get genuinely elegant — and where the streaming and batch medallion architectures reunite.
One of the most common pain points in streaming architectures is data fragmentation: your real-time data lives in one system, your historical data lives in another, and getting them to talk to each other involves either copying data or building custom connectors.
Fabric solves this through OneLake availability in Eventhouse. When enabled on a KQL table, Fabric automatically converts Eventhouse data to Parquet format and makes it available in OneLake. And the critical detail here: it's not a copy. Eventhouse uses shared storage pointers — the same data is referenced in OneLake as Delta/Parquet without duplication, which means zero additional storage cost for the exposure.
The internal flow looks like this: when events land in Eventhouse, they're initially stored in rowstore format — optimized for the lowest possible ingest latency and immediately queryable. In the background, Eventhouse asynchronously converts that rowstore data into columnar Parquet (columnstore) for long-term analytics performance and compression. It's the OneLake-exposed columnstore version that other compute engines — Spark notebooks, Lakehouse shortcuts, Power BI Direct Lake — can see and query.
A few things worth knowing before you flip the switch:
Trickling ingestion introduces lag. If your event rate is low (a handful of events per second), it can take up to 3 hours for data to appear in OneLake. Heavier ingestion rates trigger faster columnstore materialization. If you're building integrations that depend on OneLake availability, design your ingest rate accordingly.
Schema and deletion become restricted. Once OneLake availability is enabled on a table, you cannot alter the table's schema or delete data from it without first disabling the feature. Design for append-only workloads from the start.
Expose strategically. Not every table needs OneLake visibility. Over-exposing can lead to operational overhead and unnecessary cost. Enable it on the tables where cross-engine access genuinely adds value — your Gold materialized views being the most obvious candidates.
The payoff: your data science team can run Spark notebooks against real-time event data. Your Warehouse can join streaming metrics against historical batch dimensions. The ops dashboard and the quarterly business review are reading from the same truth. That's a genuinely hard problem, and the one-copy design solves it cleanly.
A Quick Word on Complexity (the Reality Check)
Streaming adds real engineering overhead. Update policies need to be lean or they'll drag down ingestion. Schema drift will bite you the first time a source team renames a field without telling anyone. Late-arriving data needs a handling strategy. Activator rules need suppression logic or your on-call team will mute the alerts within a week. and OneLake availability has enough gotchas — especially around trickling ingestion and schema locking — that it deserves its own design conversation before you enable it in production.
When the use case genuinely demands it — fraud detection, IoT monitoring, live inventory, operational alerting, clickstream personalization — the Fabric RTI stack gives you a clean, scalable path from event source to business insight and automated action, with the same Bronze/Silver/Gold discipline you'd apply in batch. Same architecture. Different speed. And if you set it up right, something batch can never be: self-responding.
Further reading:
Chris Schmidt's Blogs:
Microsoft Learn